How to Interpret AMCE and ATE
Understand attribute effects in conjoint results and survey-experiment treatment effects.
The Short Version
Understand attribute effects in conjoint results and survey-experiment treatment effects. A practical way to begin is to identify the reference level or reference arm, then read the estimate as a change in selection probability or outcome value. Finish by making sure you use treatment-vs-control tables for survey experiments. The full walkthrough below explains each part in order.
Is This Guide for You?
Researchers explaining estimates in papers or presentations.
Follow These Steps
Work through these 5 steps at your own pace. The wording is intentionally practical, and you can return to the checklist at the end when you are ready to review your work.
- Identify the reference level or reference arm.
- Read the estimate as a change in selection probability or outcome value.
- Check confidence intervals.
- Use full-model AMCE tables for conjoint results.
- Use treatment-vs-control tables for survey experiments.
What This Helps You Accomplish
Interpretation mistakes are common. Clear reference categories and units make results easier for readers and reviewers.
What a Good Result Looks Like
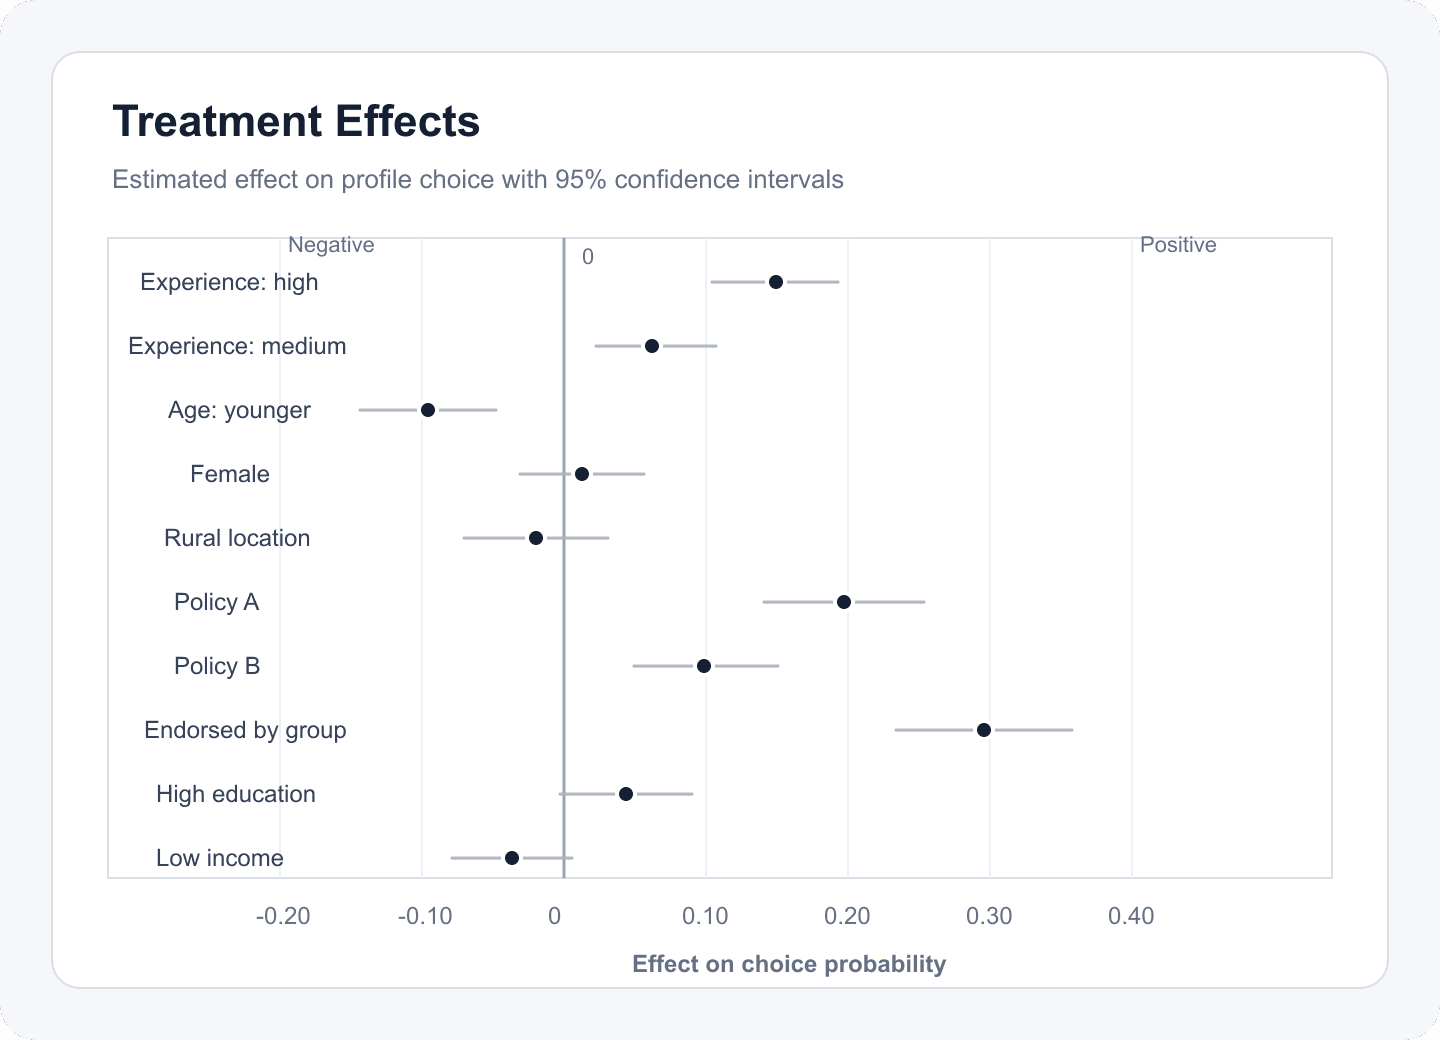
A careful interpretation states the reference level, effect direction, magnitude in probability points, uncertainty interval, and population represented by the sample. It also explains that an average effect is not a market-share forecast or a claim about every respondent.
Example: explain a price estimate
An estimate of -0.08 for a $50 price relative to a $25 reference means that profiles displaying $50 were selected about 8 percentage points less often, on average, after accounting for the randomized attributes. It does not mean sales will fall by 8%, and it does not reveal how every individual values the price difference.
Decisions to Make Before You Begin
- Confirm whether the displayed quantity is an AMCE-style level contrast or another estimand.
- Name the omitted reference category in every table and figure.
- Report the estimate and confidence interval together.
- Separate prespecified overall effects from exploratory subgroup comparisons.
Common Mistakes to Avoid
- Calling percentage-point effects percent changes.
- Interpreting statistical significance as practical importance.
- Comparing coefficients that use different references without recoding or stating the contrast.
Your Practical Next Step
Write one sentence for the estimate, one for its uncertainty, and one for its limitation. If any sentence omits the reference level, revise it.
A Quick Confidence Check
- State the reference category.
- Use percentage points for binary choice outcomes.
- Do not overinterpret small noisy estimates.
Common Questions
Can I use this guide if I am new to this?
Yes. Researchers explaining estimates in papers or presentations. Follow the steps in order, start with a small test, and use the final checklist before you field or report anything important.
What is the simplest way to get started?
Begin by identify the reference level or reference arm. Next, read the estimate as a change in selection probability or outcome value. You do not need to perfect every setting before running a small preview or pilot.
How do I know when I am ready?
Use the confidence check above. In particular: State the reference category. Use percentage points for binary choice outcomes. Do not overinterpret small noisy estimates. When the decision is consequential, keep your study documentation and ask a qualified colleague or methods reviewer to examine the design as well.
Related Guides
Research artifact: sample data, codebook, and scriptsResearch Pathways
Product names and fielding platforms mentioned in this guide belong to their respective owners. Conjoint Survey is an independent academic research tool and is not affiliated with, sponsored by, or endorsed by those services.